
Arrive Ready.
Perform from Day One.
Your graduate program will expect you to clean data, run econometric models, interpret causal estimates, and produce research ready output in R. We make sure you can before your first semester begins, no matter what field you are entering.
Greener alumni get 20% off any tier. Message us on WhatsApp before enrolling for an alumni Stripe link.
The data and econometrics gap your professors will never warn you about
DataReady is a 6 week live cohort program built for graduate students heading into any research-intensive program where you will be expected to analyze data and run econometric or statistical models. Whether your field is economics, business, finance, public policy, social sciences, education, psychology, public health, or any data-driven discipline, you will learn R, applied econometrics, causal inference methods, panel data analysis, statistical modeling, and publication-quality output before your first semester begins.
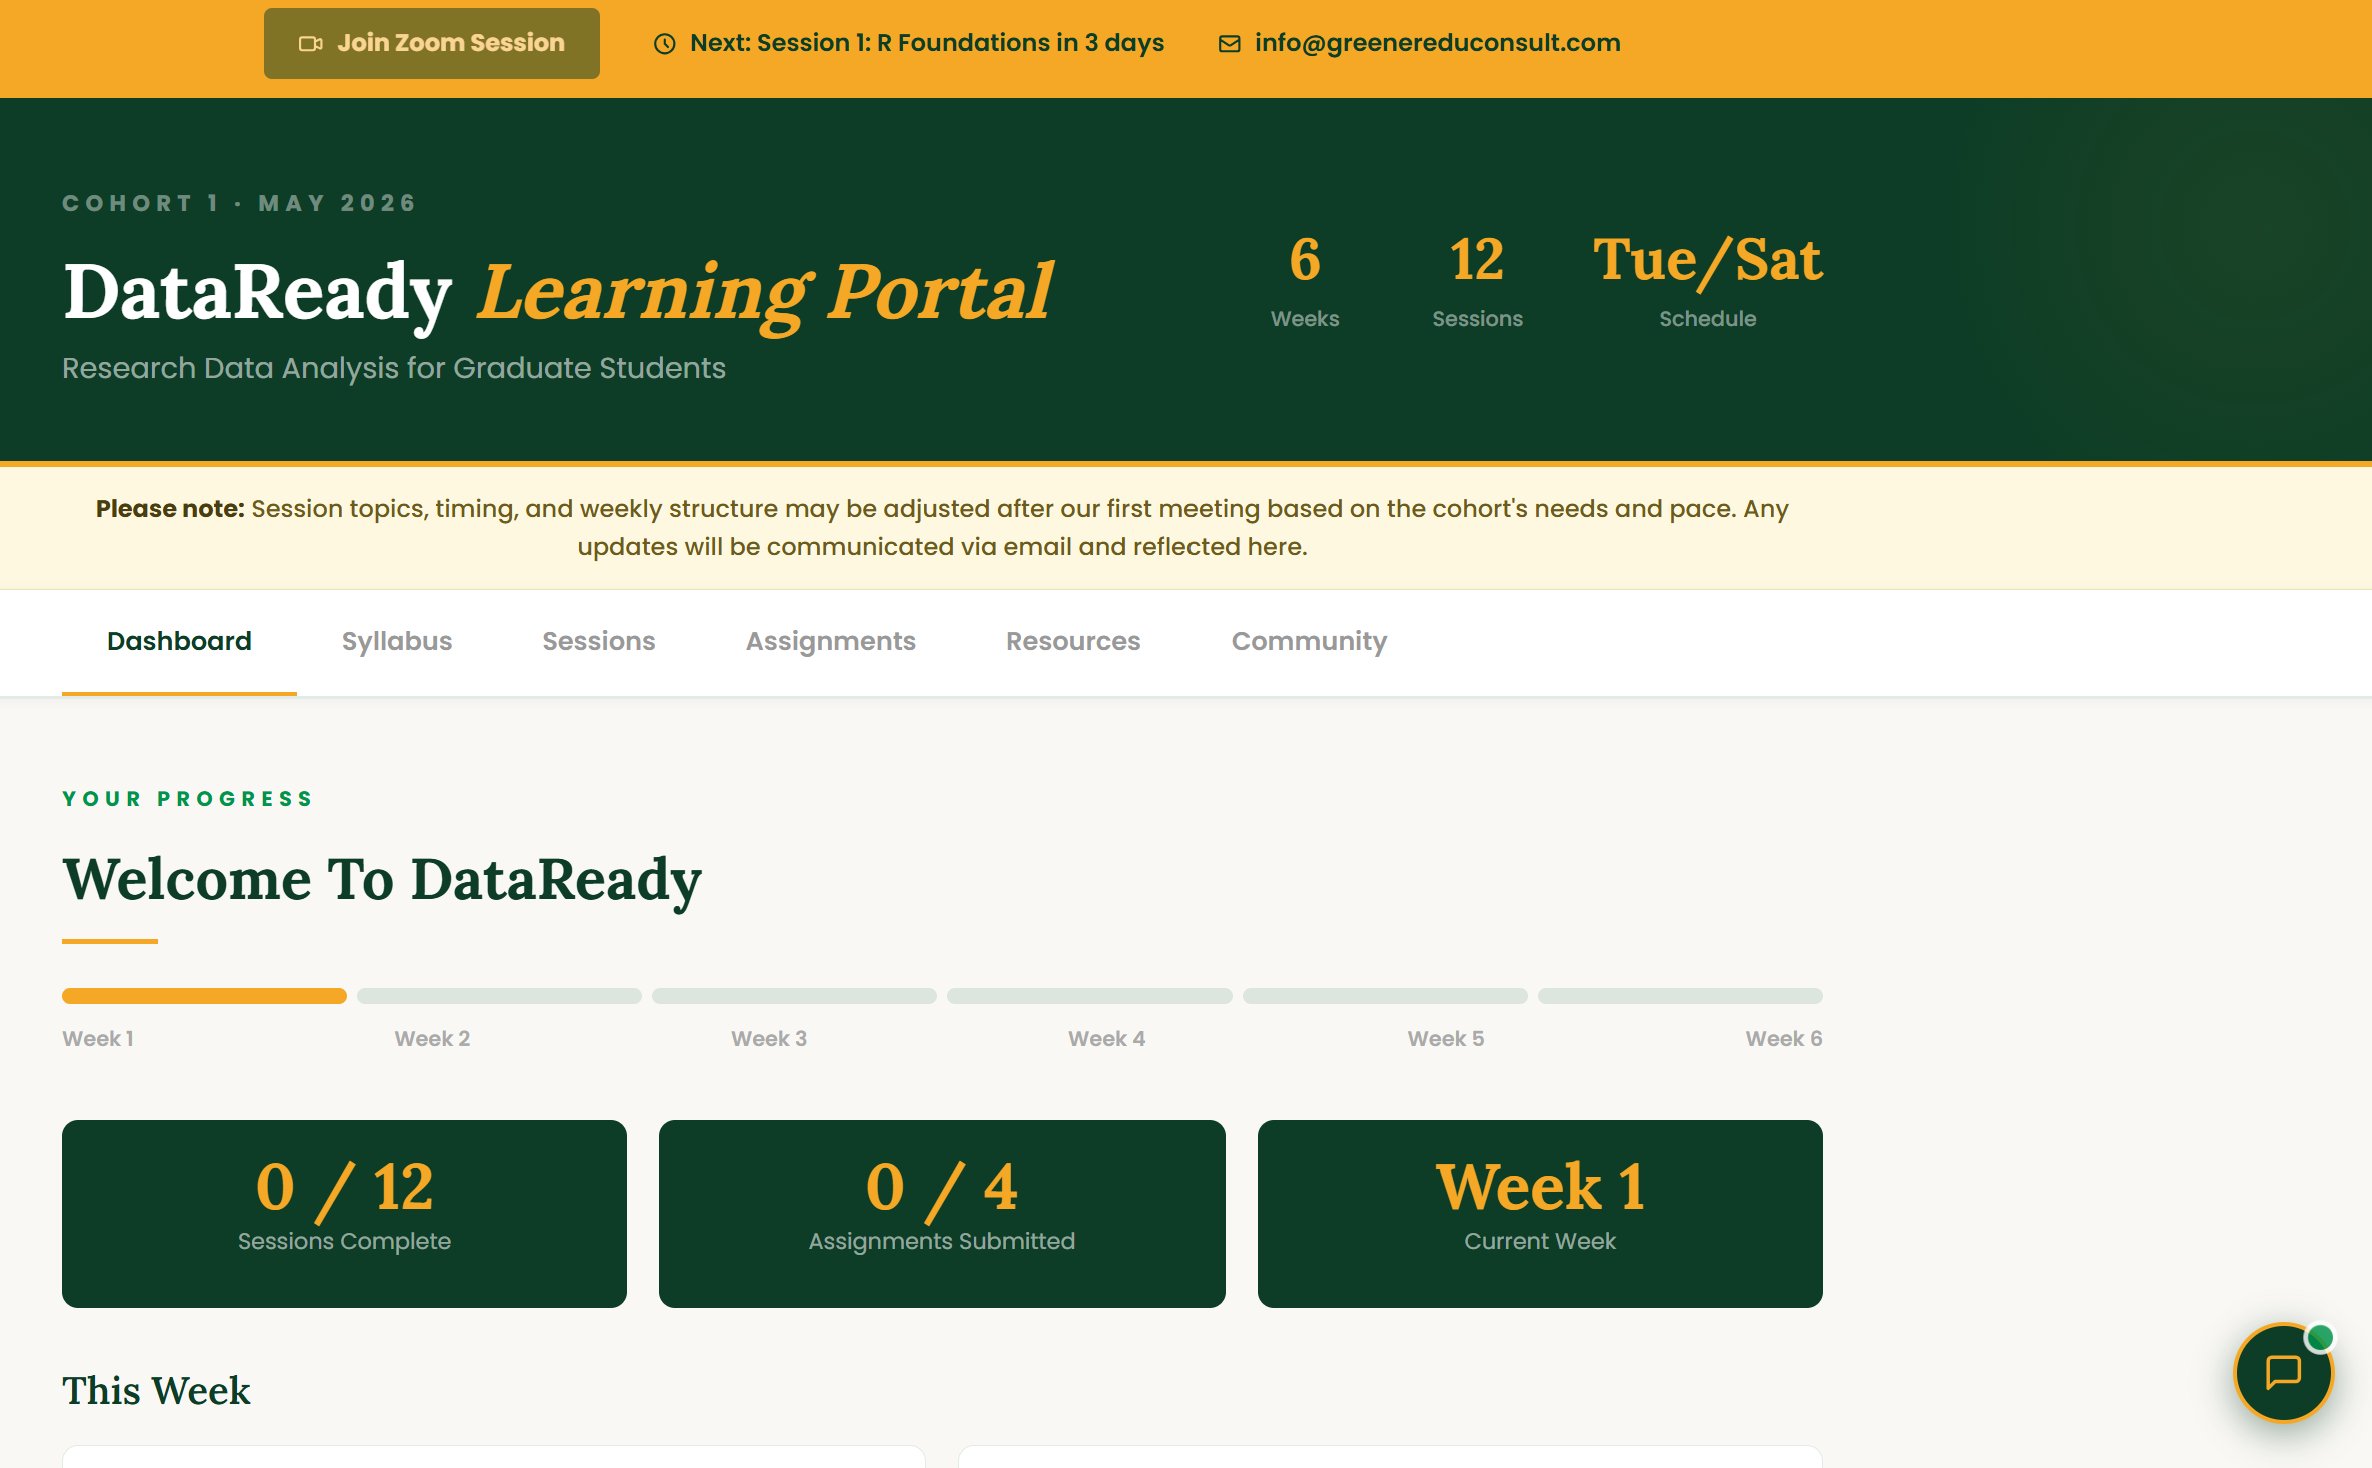
Everything you need. One place.
Every enrolled student gets a private learning portal with their dashboard, full syllabus, session recordings, assignments, datasets, and direct instructor access.
Your admission letter said nothing about this.
Three realities that hit international graduate students in their first semester. DataReady solves all of them before you ever land.
Week one of your first methods course, your professor loads a panel dataset and asks you to estimate a fixed effects model with clustered standard errors. They do not teach you the software. They assume you already know how to operate in R or Stata.
By the time you realize you cannot estimate a difference-in-differences model or interpret an instrumental variable regression, the semester is already four weeks in. Catching up while keeping up is a position most students never recover from.
Your supervisor hands you a panel dataset and says estimate a causal effect with appropriate controls and give me a clean table by Friday. If you cannot deliver, the research role or funding you worked years for becomes fragile.
# What your professor expects you to produce by Week 4 of your program

> panel %>%
+   feols(c(employed, wage_log, hours) ~
+         minwage_log + age + educ + female |
+         state + year,
+         data = .,
+         cluster = ~state) %>%
+   modelsummary(stars = c('*' = 0.1, '**' = 0.05, '***' = 0.01),
+                gof_omit = 'IC|Log|Adj|Pseudo')

                  employed     wage_log     hours
-------------------------------------------------------
minwage_log       -0.012*       0.184***    -1.42**
                  (0.007)       (0.026)     (0.58)
age                0.008***     0.021***     0.34***
educ               0.041***     0.087***     1.18***
female            -0.061***    -0.143***    -2.07***

State FE             Yes          Yes        Yes
Year FE              Yes          Yes        Yes
SE clustered      state         state      state
N               412,847      398,221    405,109
R2 within         0.142        0.287      0.198
Three steps from enrolled to prepared
DataReady is a live cohort, not a self paced course. Every student moves through the same program together with live instruction and real feedback.
You receive your welcome packet, datasets, R installation guide, and access to the private cohort WhatsApp group before the first session.
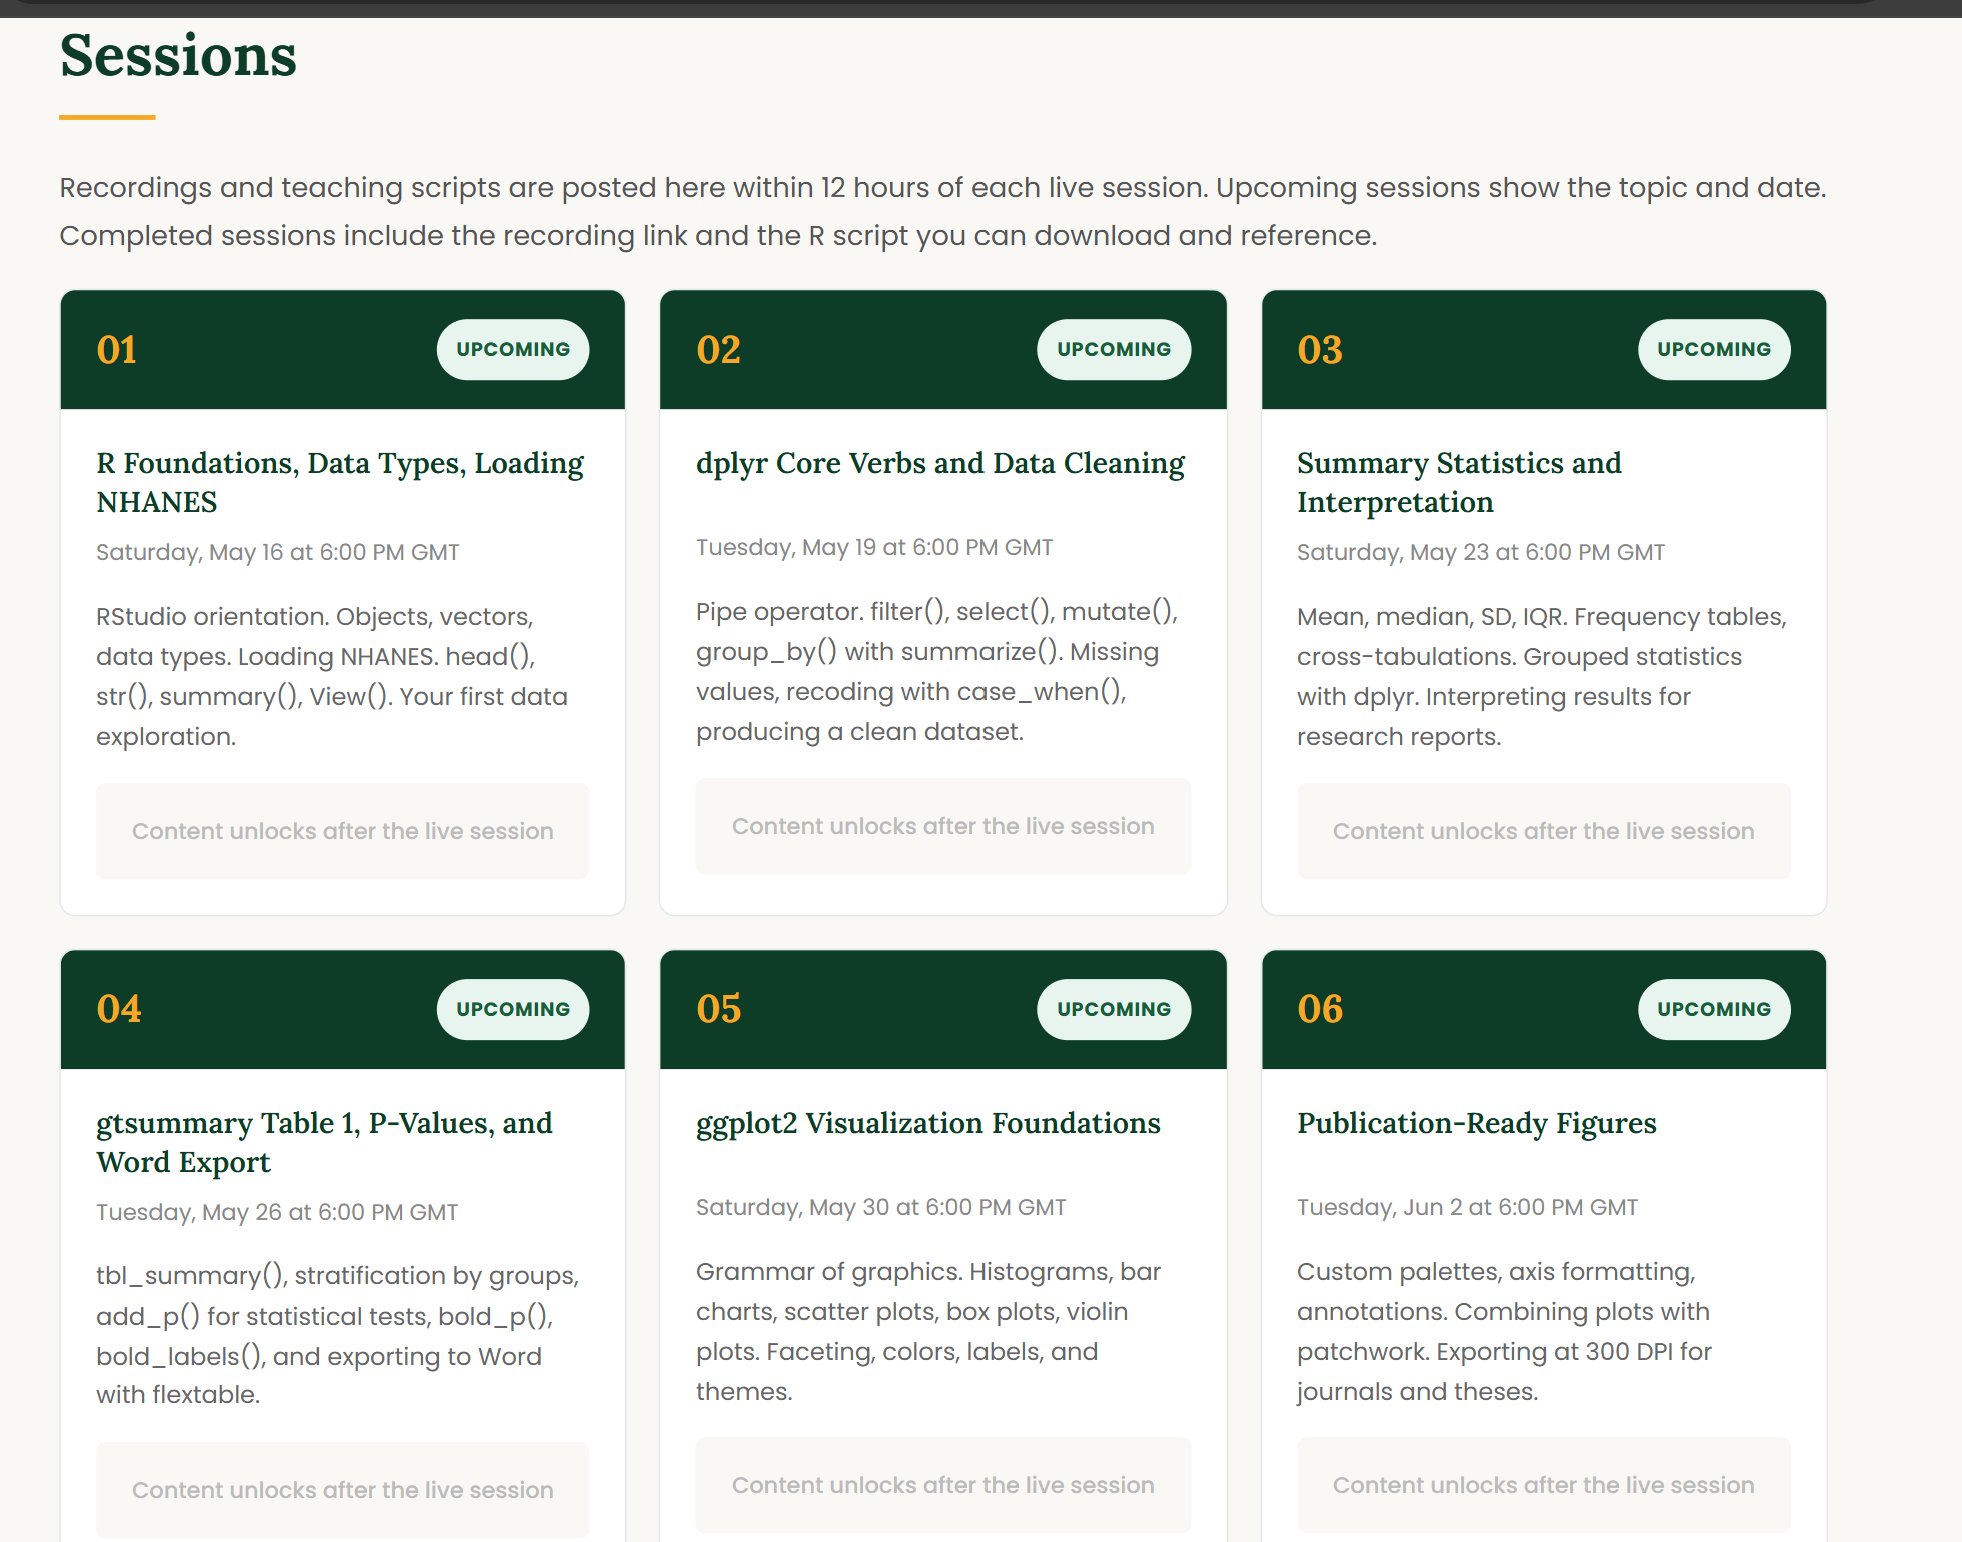
Three live Zoom sessions each week over 6 weeks. You work through real panel datasets, estimate causal models, complete assignments, and get direct feedback from your instructor.
On the final session you present an original analysis with research tables, regression output, and a forest plot. You receive your certificate and a First Semester Survival Kit.
Three pillars. One program built for your exact situation.
DataReady is not a generic R course. It was built around three pillars that address everything a student needs to arrive ready for graduate school.
The core of the program. From data cleaning through OLS, panel data with fixed effects, instrumental variables, difference-in-differences, time series, and survival analysis, all taught on real datasets. You learn to produce publication ready research tables with modelsummary and gtsummary, and professional figures with ggplot2, the same output expected in graduate programs across economics, business, policy, and the social sciences.
A dedicated module on using ChatGPT and Claude ethically and effectively for graduate school. How to debug code with AI, use it to understand econometric output, and get writing feedback without crossing academic integrity lines.
The invisible knowledge most students learn the hard way. Advisor relationships, office hours culture, how to communicate with professors, managing imposter syndrome, and building your peer network before you land.
You will not learn on fake or simplified data.
DataReady trains you on large, real, publicly available datasets so the skills you build transfer directly to whatever data your own field gives you. We use the National Health and Nutrition Examination Survey and the National Health Interview Survey as our teaching datasets because they are massive, well documented, and structurally similar to the cross-sectional, panel, administrative, and survey datasets used across economics, business, finance, social sciences, education, public policy, and health disciplines. The R, econometric, and visualization skills are the same no matter what data your program hands you.
A rich, nationally representative survey combining interviews with physical and lab measurements. Over 10,000 observations and hundreds of variables. Perfect for teaching data cleaning, descriptive analysis, regression, and visualization on data that behaves the way real research data behaves.
Primary Teaching DatasetRunning since 1957, NHIS contains multi-year panel data on demographics, household structure, economics, and wellbeing. Ideal for teaching fixed effects, difference-in-differences, and longitudinal regression. The patterns and methods translate directly to datasets in economics, finance, labor research, and policy.
Primary Teaching DatasetIn Premium and Private tiers, your instructor adapts assignments to datasets from your own field of study whenever available.
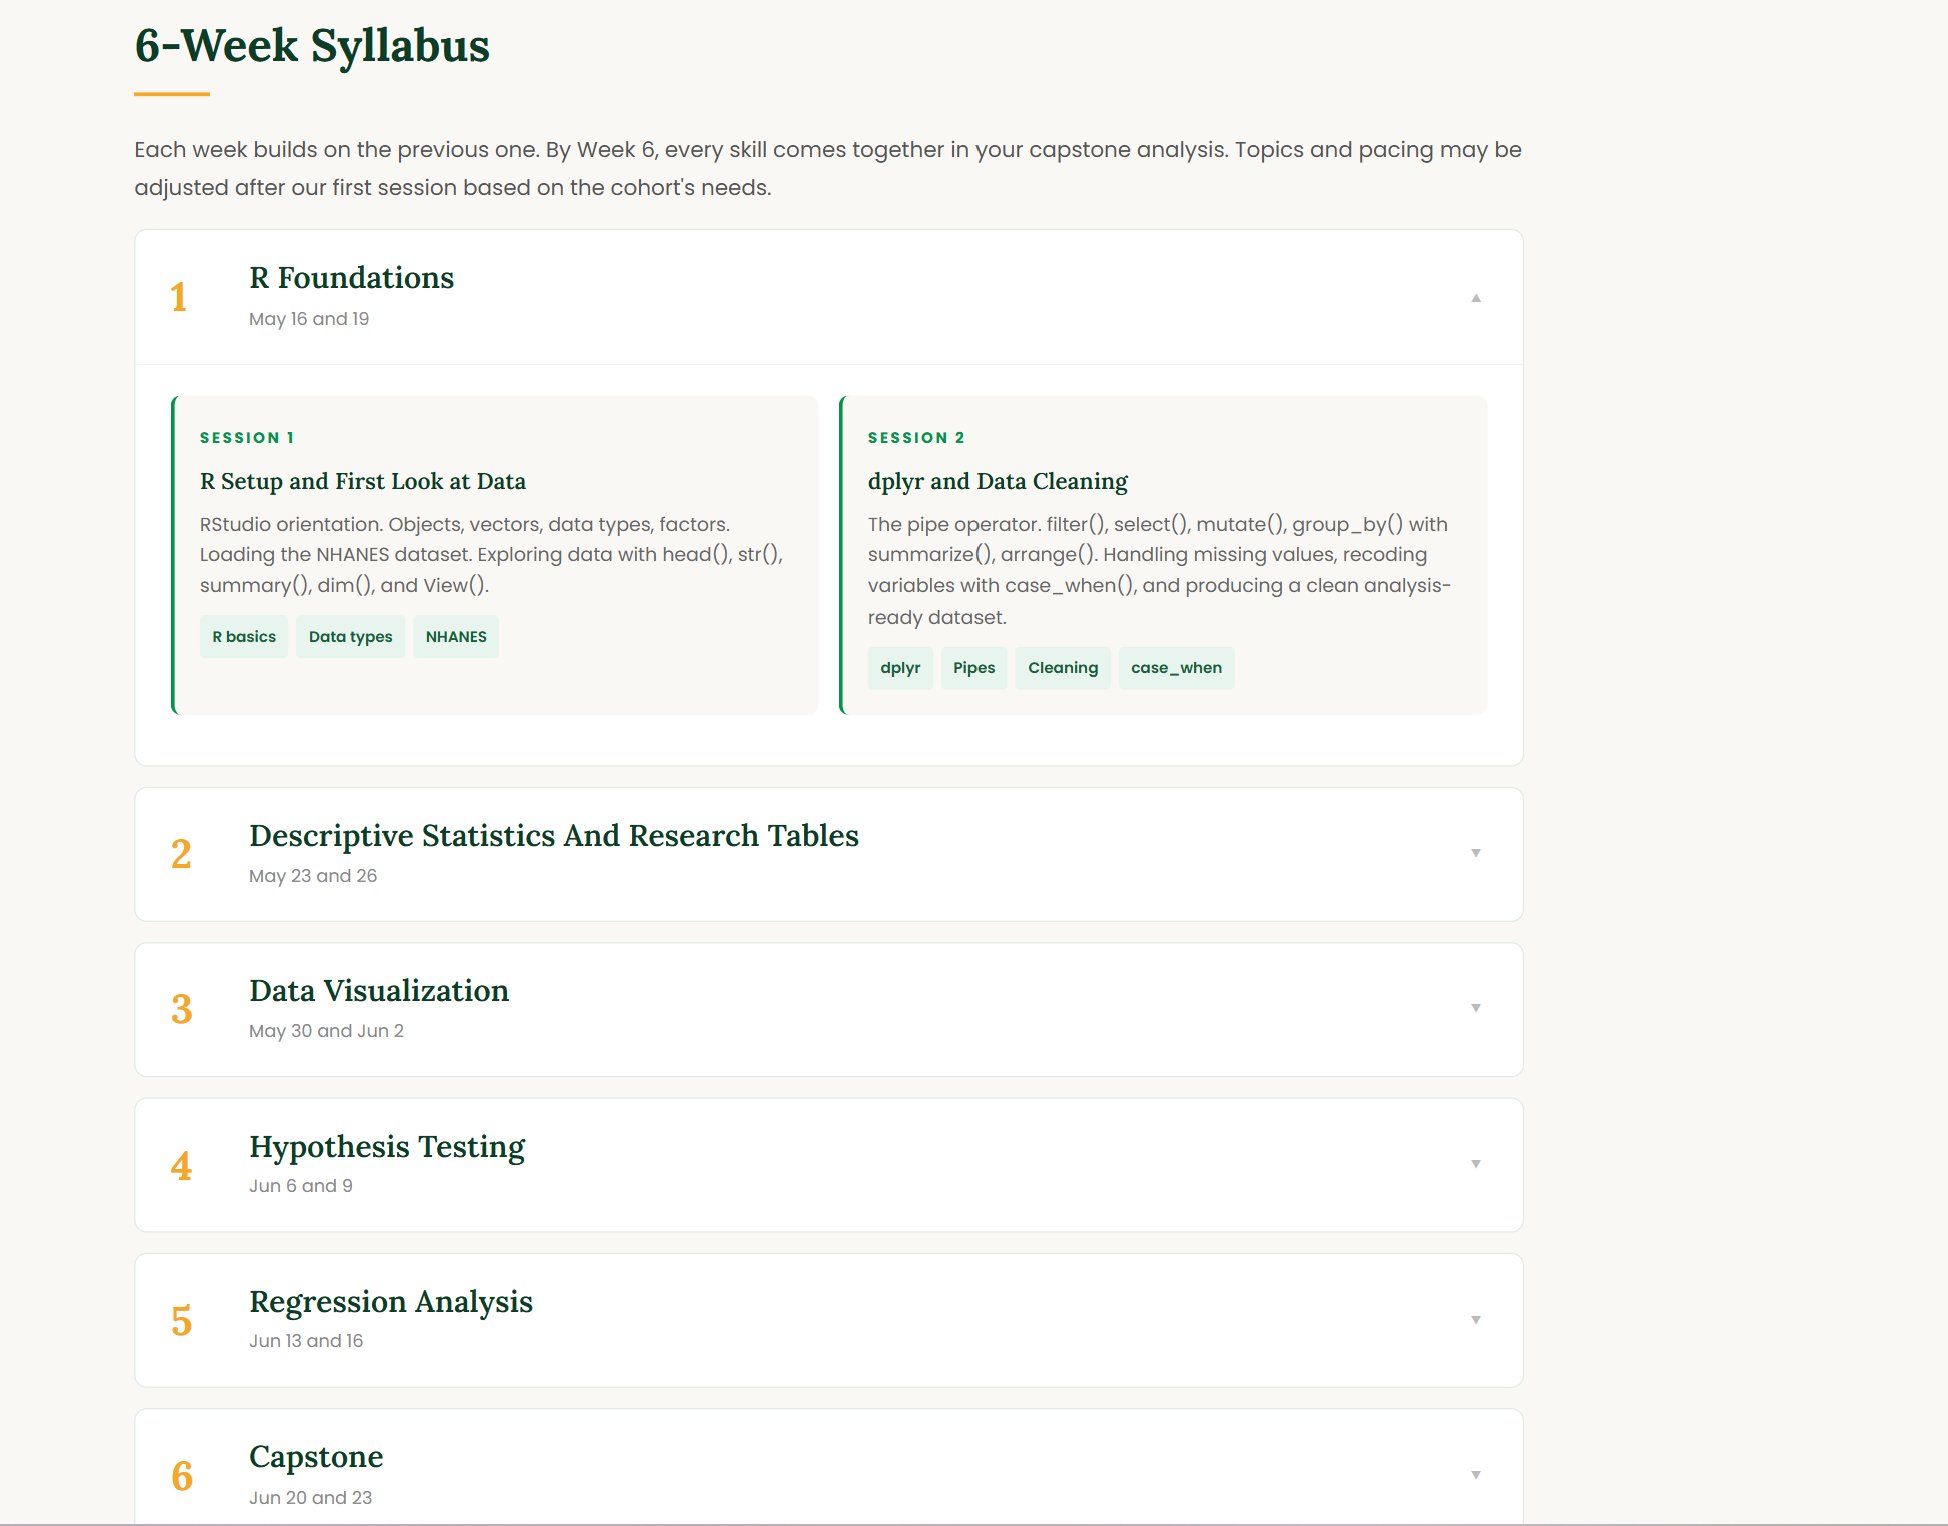
Six weeks. Real datasets. Skills your professors expect on day one.
Every week builds on real data. By week 6, you will have produced research tables, regression output, professional figures, and a complete capstone analysis ready to showcase in any field.
How researchers think about data. Installing R and RStudio. Understanding objects, vectors, and data frames. Loading and exploring a large real dataset for the first time. The dplyr and tidyr verbs that power real analysis: filter, select, mutate, group_by, summarize, pivot. Handling missing values, recoding variables, and merging datasets the way researchers do every day.
Summary statistics, frequency tables, cross-tabulations, and publication ready output using gtsummary and modelsummary. ggplot2 from the ground up: bar charts, histograms, scatter plots, coefficient plots, and forest plots. By end of this week you produce a professional descriptive table and a clean figure from your own analysis.
OLS regression from the ground up. Interpreting coefficients, confidence intervals, p-values, and standard errors. Hypothesis testing. Heteroskedasticity-robust standard errors. Logistic regression for binary outcomes, odds ratios, and adjusted models. Producing clean regression tables side by side with modelsummary, the format every methods paper uses.
Working with panel data structures. Pooled OLS, fixed effects, and random effects models with the fixest package. Why one-way and two-way fixed effects matter. Clustered standard errors and why they change your inference. The workhorse model for empirical economics, finance, labor, and policy research.
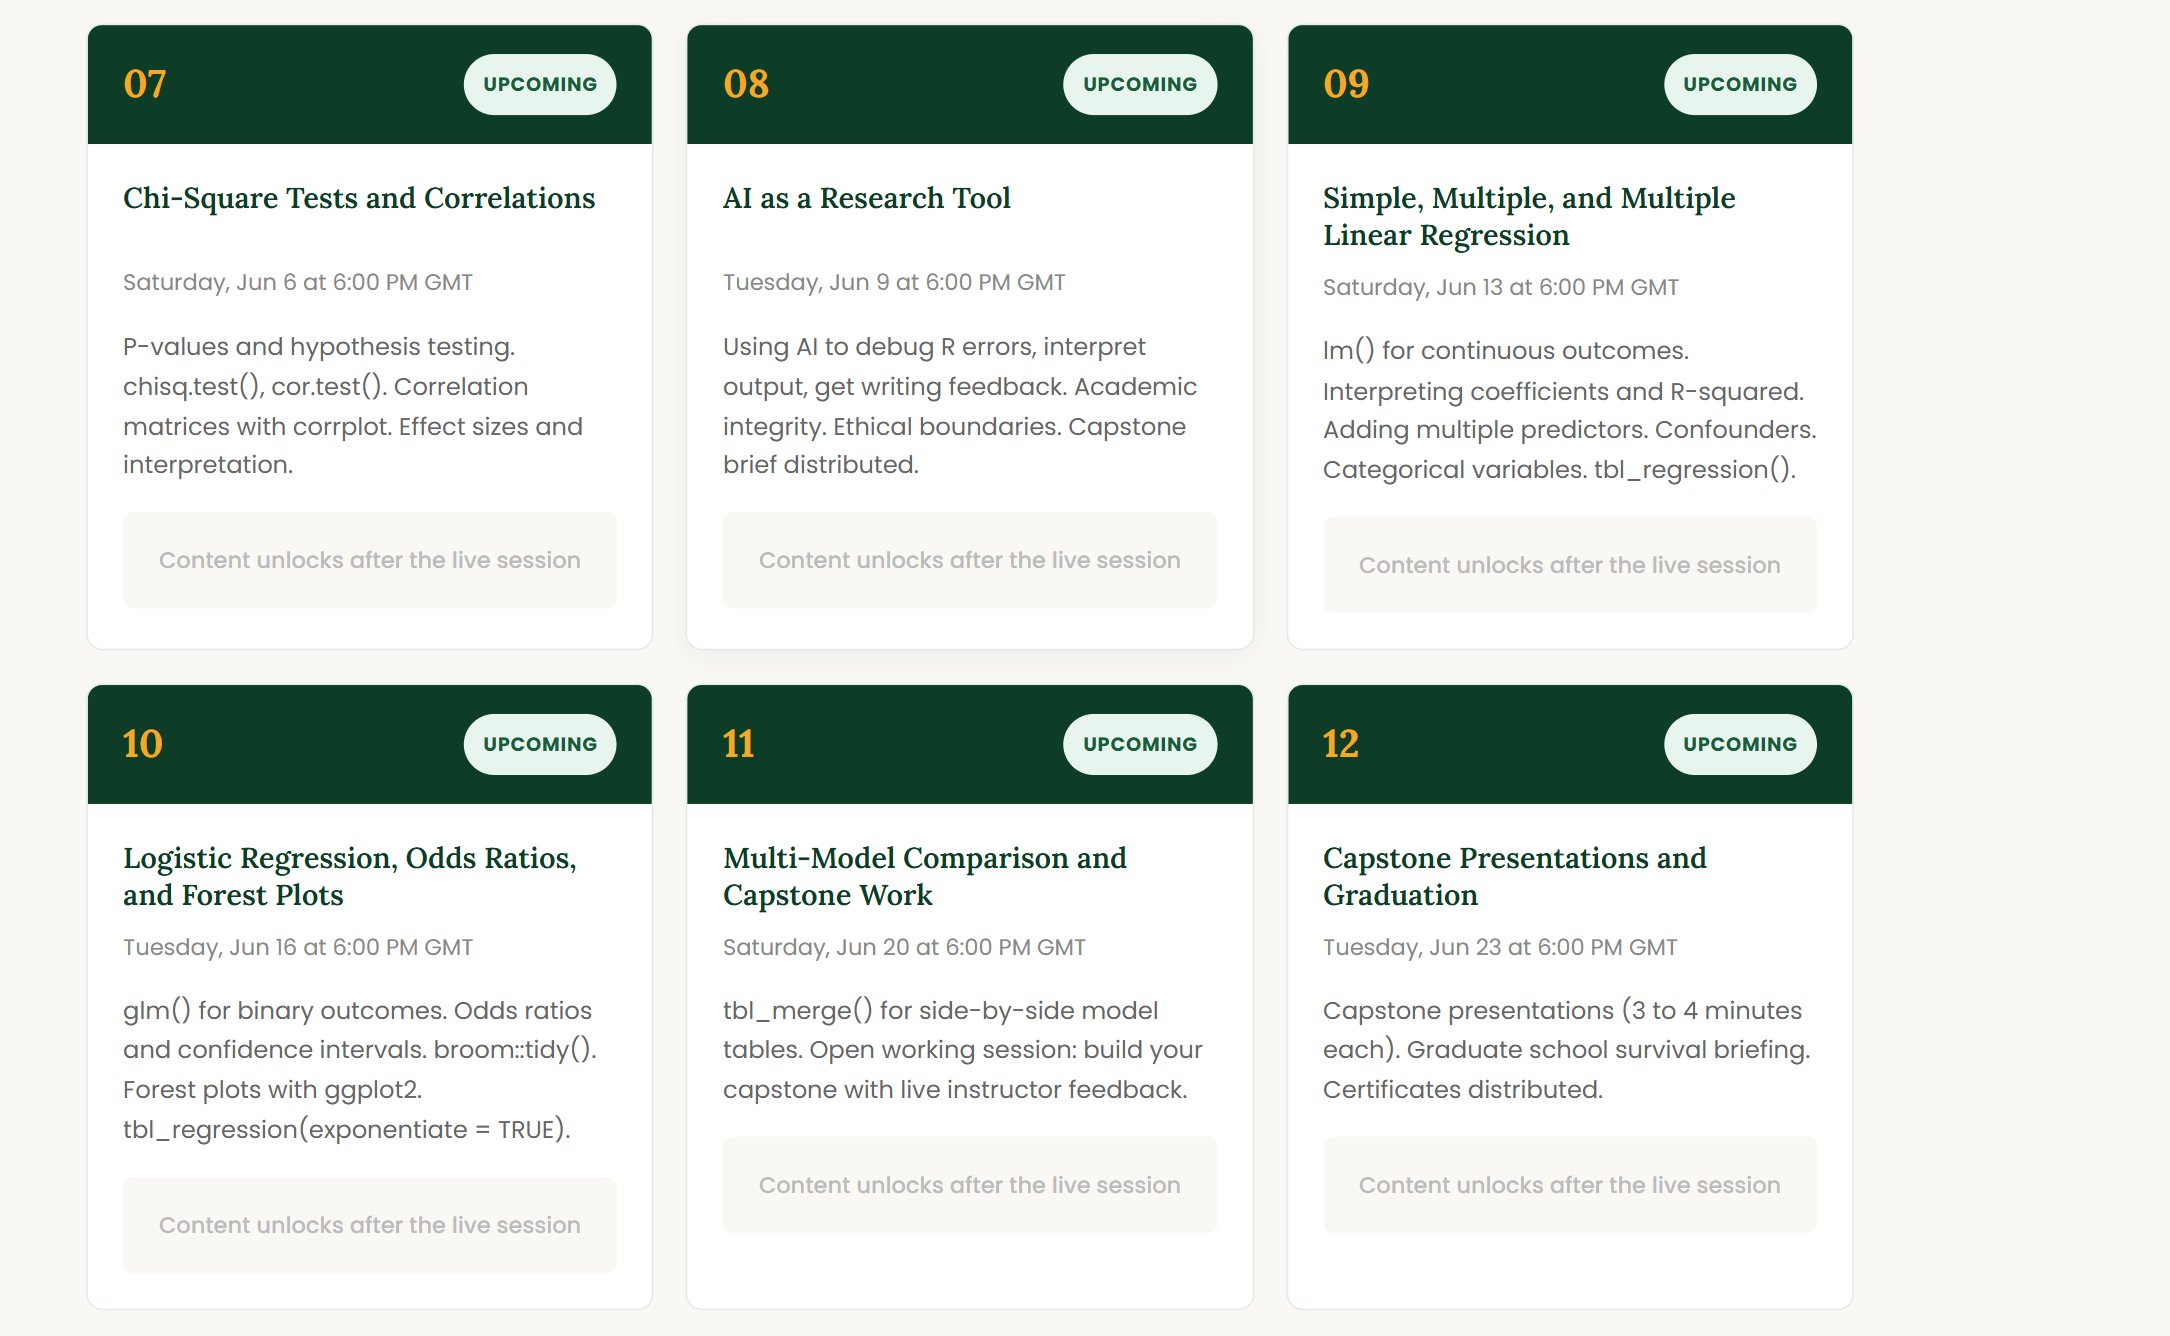
The methods that drive modern empirical research. Instrumental variables and 2SLS for endogeneity. Classical and staggered difference-in-differences with event study plots. Parallel trends, pre-trends testing, and the recent advances in DiD methodology. The exact tools your econometrics, policy evaluation, and applied research courses will demand.
A working knowledge of time series essentials: stationarity, autocorrelation, ARIMA, and forecasting in R. Survival analysis with Kaplan-Meier curves and Cox proportional hazards models for time-to-event data. Ethical AI use for academic work. Then the capstone symposium: each student presents one original analysis with a clean research table, regression output, and a publication-quality figure.
| Variable | Coef. | 95% CI | p-value |
|---|---|---|---|
| Treatment (post) | 0.184 | 0.133, 0.235 | <0.001 |
| Income (log) | 0.218 | 0.138, 0.298 | <0.001 |
| Age | 0.014 | 0.010, 0.018 | <0.001 |
| Years of education | 0.097 | 0.060, 0.134 | <0.001 |
| Female | -0.143 | -0.180, -0.106 | <0.001 |
| Married | 0.062 | 0.018, 0.106 | 0.006 |
| State and year fixed effects included. Standard errors clustered at state level. R2 within = 0.184. Bold indicates statistical significance (p < 0.05). | |||
# The R code that produces the table above

> library(fixest); library(modelsummary)

> m1 <- feols(insured ~ treated_post + income_log + age +
+              educ_yrs + female + married |
+              state + year,
+              data = nhis_panel,
+              cluster = ~state)

> modelsummary(m1,
+   stars = c('*' = 0.1, '**' = 0.05, '***' = 0.01),
+   gof_omit = 'IC|Log|Adj|Pseudo',
+   output = "table4_fixed_effects.docx")
NHANES. A real public health dataset.
No toy data. No made-up examples. You will work with the National Health and Nutrition Examination Survey, a CDC dataset used by graduate researchers, public health professionals, and biostatistics programs around the world. It is the same kind of data that goes into the journal articles your professors expect you to cite.
Starter pack: slim CSV, full CSV, raw CSV, and a walkthrough R script. About 167 KB compressed.
What you will walk into your program able to do.
These are not theoretical outcomes. These are the exact tasks your courses, professors, and supervisors will assign you in your first semester.
Your professor assigns a panel data analysis with two-way fixed effects and clustered standard errors. You open R, structure the data, run the model, and produce a clean regression table with interpretation before the deadline.
Your methods course requires a DiD evaluation with parallel trends checks and an event study plot. You produce the full analysis with the fixest package and present it the way every applied paper does.
Your supervisor asks for a side-by-side comparison of three model specifications. You produce a clean modelsummary table with stars, fixed effects rows, and clustered standard errors, ready for a working paper.
When your professor asks what a coefficient of 0.184 means in context, or whether your DiD estimate identifies a causal effect, you answer without hesitation.
You know how to access, clean, reshape, and analyze real survey, panel, and administrative data. When your professor or supervisor hands you a dataset with hundreds of thousands of observations, you already know how to approach it.
You know how to use ChatGPT and Claude to debug R code, explain econometric concepts, and get feedback on your writing without violating your university's academic integrity policy.
Built for a very specific student at a very specific moment.
DataReady is not for everyone. It was built for students at one particular stage of their journey, and it is exactly right for that stage.
You have been admitted to a graduate program where you will be expected to analyze data, run econometric or statistical models, or produce empirical research
Your field is any research-intensive discipline, including economics, business, finance, public policy, social sciences, psychology, education, public health, or data science
You are starting in Fall 2026 or January 2027 and want to arrive prepared, not spend your first semester catching up
Your data analysis or econometrics skills are limited or rusty and you want to fix that before you land, not after your first midterm
You want live instruction with real feedback, not a video course you will abandon by Week 2
You are an early career researcher or professional who needs R, econometrics, and applied data skills to advance your work
You are already comfortable estimating fixed effects models, instrumental variable regressions, and difference-in-differences in R. DataReady is designed for students building these skills from the ground up. If you already produce modelsummary tables and event study plots in your sleep, this program will feel slow for you.
Real Students. Real Preparation.
"I arrived at my program already knowing how to clean panel data, run fixed effects regressions, and produce a clean research table. My classmates were still installing R in Week 3. That head start changed everything about my first semester."
"My research supervisor handed me a panel dataset on day one and asked for a difference-in-differences analysis by Friday. Because of DataReady, I delivered it with a clean event study plot. She told me she had never seen a first year do that."
"I thought I would pick up R and econometrics when I got there. I did not. The first semester was brutal. I wish DataReady had existed when I was preparing to leave."
"I came from an MBA background with almost no econometrics. By Week 4 I was running fixed effects regressions for my empirical finance class. The live format made everything click in a way videos never did."
"Learning instrumental variables and difference-in-differences before arriving meant I already understood the methods my professors were referencing. That familiarity gave me confidence I did not expect to have."
"The fixest and modelsummary modules alone were worth the entire investment. I produced cleaner regression tables than some second year students. My professor asked me where I learned it."
Register and complete checkout.
Cohort 1 begins May 16, 2026. Only 25 seats. Fill in your details, choose your tier, and we will redirect you to Stripe to complete payment.
Frequently Asked Questions
No. DataReady starts from the very beginning. The only requirement is that you can operate a computer and you are willing to show up and practice. Students with zero prior exposure to R have completed this program and arrived confident in their first semester.
The curriculum and core training are identical across all tiers. Cohort is the live group experience. Premium adds 3 private sessions, a Curriculum Vitae review, and personalized dataset selection. Private is fully 1-on-1, flexible around your schedule, and built around your research focus with unlimited messaging during the program.
All sessions are recorded. Cohort students get 30 day recording access, Premium gets 60 days, Private gets 90 days. We strongly encourage live attendance because the interaction and real time feedback are where most of the learning happens, but we understand schedules sometimes conflict.
Any graduate program where you will be expected to analyze data and run empirical models. That includes economics, business, finance, accounting, public policy, political science, sociology, psychology, education, public health, epidemiology, biostatistics, health services research, agriculture, environmental sciences, and data science. If your program involves working with data and you are not yet confident in R and applied econometrics, this program was designed for you.
Yes. DataReady covers descriptive statistics, OLS, logistic regression, panel data with fixed effects, instrumental variables, difference-in-differences, time series, and survival analysis. These are the exact methods your first semester quantitative methods, econometrics, and applied research courses will cover. You will arrive knowing the R code and the interpretation, not just the theory.
Because live instruction with real feedback only works at a scale where your instructor can actually see you, respond to your questions, and know where you are struggling. Large cohorts produce passive students. DataReady is built for active learners who want genuine engagement.
Three live sessions per week over 6 weeks, plus one practice assignment that typically takes 60 to 90 minutes. Total approximately 5 to 6 hours per week. Designed to be intensive enough to build real skills without overwhelming someone also finishing their final semester or working.
Because practice data is clean and small, and real data is messy and large. The skills you need in your graduate program are the skills for handling real research data. We use two large, well documented public datasets for teaching because they behave the way real research datasets behave. The R skills, econometric methods, and research table techniques transfer directly to whatever data your own field uses.
Full refund up to 7 days before the cohort begins if you decide DataReady is not right for you. After the first live session, refunds are prorated based on sessions attended.
Yes. DataReady is built around the graduate school context but the R skills, applied econometrics, causal inference methods, and AI literacy module are valuable for any researcher or early career professional anywhere in the world.

Built by someone who runs regressions every day.
DataReady was created by a doctoral researcher at the University of Florida who uses R, applied econometrics, panel data methods, and modelsummary in active research daily. This is not someone who learned R to teach it. This is someone who lives inside the tool and built a program around what actually matters when you enter any research-intensive graduate program.
Since founding Greener Educational Consult in 2018, over 500 students across 20 countries have been guided into funded graduate programs in the US, UK, Canada, and Europe. The one consistent gap that emerges after admission is data and econometrics skills. Students arrive to their programs and find themselves behind from the first week, unable to estimate a basic fixed effects model or produce the regression tables their professors expect.
DataReady is the direct answer to that gap. Six weeks of live training on the exact econometric methods, research table formats, and visualization techniques that graduate programs demand across economics, business, finance, policy, and the social sciences. Taught by someone who knows what your professors will ask for, because they produce that same output every day.
Your first semester starts before you land.
25 seats. One cohort. May 16, 2026. The students who enroll today will arrive in their programs producing clean fixed effects regressions and event study plots while their classmates are still figuring out how to install R.
Reserve Your SeatStill weighing it up? Book a 30 minute call and we will walk you through which tier fits your situation.